Spring Boot Actuator metrics monitoring with Prometheus and Grafana
Spring BootJune 25, 20184 mins read
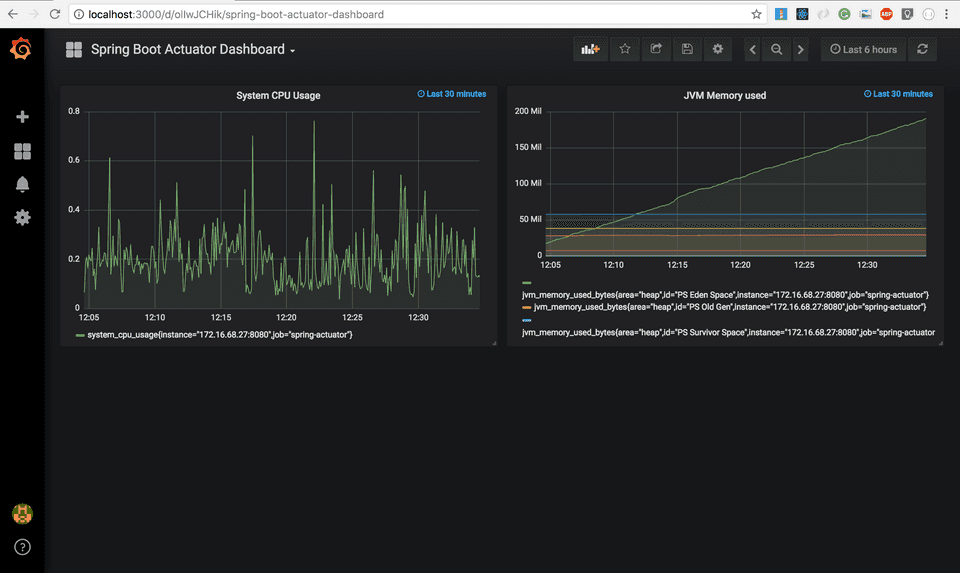 Welcome to the second part of the Spring Boot Actuator tutorial series. In the first part, you learned what
 spring-boot-actuator module does, how to configure it in a spring boot application, and how to interact with various actuator endpoints.
In this article, you’ll learn how to integrate spring boot actuator with a monitoring system called Prometheus and a graphing solution called Grafana.
At the end of this article, you’ll have a Prometheus as well as a Grafana dashboard setup in your local machine where you’ll be able to visualize and monitor all the metrics generated from the Spring Boot application.
Prometheus
Prometheus is an open-source monitoring system that was originally built by SoundCloud. It consists of the following core components -
A data scraper that pulls metrics data over HTTP periodically at a configured interval.
A time-series database to store all the metrics data.
A simple user interface where you can visualize, query, and monitor all the metrics.
Grafana
Grafana allows you to bring data from various data sources like Elasticsearch, Prometheus, Graphite, InfluxDB etc, and visualize them with beautiful graphs.
It also lets you set alert rules based on your metrics data. When an alert changes state, it can notify you over email, slack, or various other channels.
Note that, Prometheus dashboard also has simple graphs. But Grafana’s graphs are way better. That’s why, in this post, we’ll integrate Grafana with Prometheus to import and visualize our metrics data.
Adding Micrometer Prometheus Registry to your Spring Boot application
Spring Boot uses Micrometer, an application metrics facade to integrate actuator metrics with external monitoring systems.
It supports several monitoring systems like Netflix Atlas, AWS Cloudwatch, Datadog, InfluxData, SignalFx, Graphite, Wavefront, Prometheus etc.
To integrate actuator with Prometheus, you need to add the micrometer-registry-prometheus dependency -
<!-- Micrometer Prometheus registry  -->
<dependency>
	<groupId>io.micrometer</groupId>
	<artifactId>micrometer-registry-prometheus</artifactId>
</dependency>
Once you add the above dependency, Spring Boot will automatically configure a PrometheusMeterRegistry and a CollectorRegistry to collect and export metrics data in a format that can be scraped by a Prometheus server.
All the application metrics data are made available at an actuator endpoint called /prometheus. The Prometheus server can scrape this endpoint to get metrics data periodically.
Exploring Spring Boot Actuator’s /prometheus Endpoint
Let’s explore the prometheus endpoint that is exposed by Spring Boot when micrometer-registry-prometheus dependency is available on the classpath.
First of all, you’ll start seeing the prometheus endpoint on the actuator endpoint-discovery page (http://localhost:8080/actuator) -
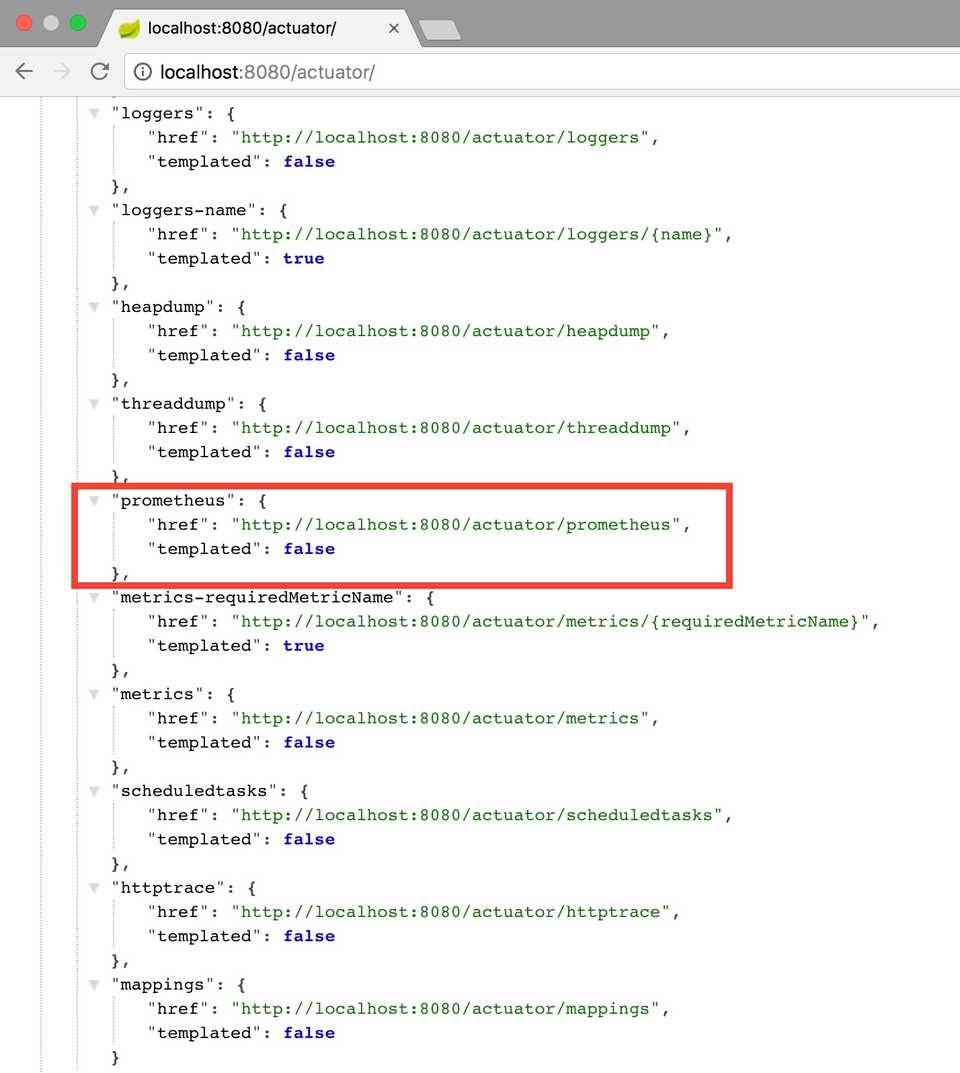 The
The prometheus endpoint exposes metrics data in a format that can be scraped by a Prometheus server. You can see the exposed metrics data by navigating to the prometheus endpoint (http://localhost:8080/actuator/prometheus) -
# HELP jvm_buffer_memory_used_bytes An estimate of the memory that the Java virtual machine is using for this buffer pool
# TYPE jvm_buffer_memory_used_bytes gauge
jvm_buffer_memory_used_bytes{id="direct",} 81920.0
jvm_buffer_memory_used_bytes{id="mapped",} 0.0
# HELP jvm_threads_live The current number of live threads including both daemon and non-daemon threads
# TYPE jvm_threads_live gauge
jvm_threads_live 23.0
# HELP tomcat_global_received_bytes_total
# TYPE tomcat_global_received_bytes_total counter
tomcat_global_received_bytes_total{name="http-nio-8080",} 0.0
# HELP jvm_gc_pause_seconds Time spent in GC pause
# TYPE jvm_gc_pause_seconds summary
jvm_gc_pause_seconds_count{action="end of minor GC",cause="Allocation Failure",} 7.0
jvm_gc_pause_seconds_sum{action="end of minor GC",cause="Allocation Failure",} 0.232
jvm_gc_pause_seconds_count{action="end of minor GC",cause="Metadata GC Threshold",} 1.0
jvm_gc_pause_seconds_sum{action="end of minor GC",cause="Metadata GC Threshold",} 0.01
jvm_gc_pause_seconds_count{action="end of major GC",cause="Metadata GC Threshold",} 1.0
jvm_gc_pause_seconds_sum{action="end of major GC",cause="Metadata GC Threshold",} 0.302
# HELP jvm_gc_pause_seconds_max Time spent in GC pause
# TYPE jvm_gc_pause_seconds_max gauge
jvm_gc_pause_seconds_max{action="end of minor GC",cause="Allocation Failure",} 0.0
jvm_gc_pause_seconds_max{action="end of minor GC",cause="Metadata GC Threshold",} 0.0
jvm_gc_pause_seconds_max{action="end of major GC",cause="Metadata GC Threshold",} 0.0
# HELP jvm_gc_live_data_size_bytes Size of old generation memory pool after a full GC
# TYPE jvm_gc_live_data_size_bytes gauge
jvm_gc_live_data_size_bytes 5.0657472E7

## More data ...... (Omitted for brevity)
Downloading and Running Prometheus using Docker
1. Downloading Prometheus
You can download the Prometheus docker image using docker pull command like so -
$ docker pull prom/prometheusOnce the image is downloaded, you can type docker image ls command to view the list of images present locally -
$ docker image ls
REPOSITORY                                   TAG                 IMAGE ID            CREATED             SIZE
prom/prometheus                              latest              b82ef1f3aa07        5 days ago          119MB
2. Prometheus Configuration (prometheus.yml)
Next, We need to configure Prometheus to scrape metrics data from Spring Boot Actuator’s /prometheus endpoint.
Create a new file called prometheus.yml with the following configurations -
# my global config
global:
  scrape_interval:     15s # Set the scrape interval to every 15 seconds. Default is every 1 minute.
  evaluation_interval: 15s # Evaluate rules every 15 seconds. The default is every 1 minute.
  # scrape_timeout is set to the global default (10s).

# Load rules once and periodically evaluate them according to the global 'evaluation_interval'.
rule_files:
  # - "first_rules.yml"
  # - "second_rules.yml"

# A scrape configuration containing exactly one endpoint to scrape:
# Here it's Prometheus itself.
scrape_configs:
  # The job name is added as a label `job=<job_name>` to any timeseries scraped from this config.
  - job_name: 'prometheus'
    # metrics_path defaults to '/metrics'
    # scheme defaults to 'http'.
    static_configs:
    - targets: ['127.0.0.1:9090']

  - job_name: 'spring-actuator'
    metrics_path: '/actuator/prometheus'
    scrape_interval: 5s
    static_configs:
    - targets: ['HOST_IP:8080']
The above configuration file is an extension of the basic configuration file available in the Prometheus documentation.
The most important stuff to note in the above configuration file is the spring-actuator job inside scrape_configs section.
The metrics_path is the path of the Actuator’s prometheus endpoint. The targets section contains the HOST and PORT of your Spring Boot application.
Please make sure to replace the HOST_IP with the IP address of the machine where your Spring Boot application is running. Note that, localhost won’t work here because we’ll be connecting to the HOST machine from the docker container. You must specify the network IP address.
3. Running Prometheus using Docker
Finally, Let’s run Prometheus using Docker. Type the following command to start a Prometheus server in the background -
$ docker run -d --name=prometheus -p 9090:9090 -v <PATH_TO_prometheus.yml_FILE>:/etc/prometheus/prometheus.yml prom/prometheus --config.file=/etc/prometheus/prometheus.ymlPlease make sure to replace the <PATH_TO_prometheus.yml_FILE> with the PATH where you have stored the Prometheus configuration file.
After running the above command, docker will start the Prometheus server inside a container. You can see the list of all the containers with the following command -
$ docker container ls
CONTAINER ID        IMAGE               COMMAND                  CREATED             STATUS              PORTS                    NAMES
e036eb20b8ad        prom/prometheus     "/bin/prometheus --c…"   4 minutes ago       Up 4 minutes        0.0.0.0:9090->9090/tcp   prometheus
4. Visualizing Spring Boot Metrics from Prometheus dashboard
That’s it! You can now navigate to http://localhost:9090 to explore the Prometheus dashboard.
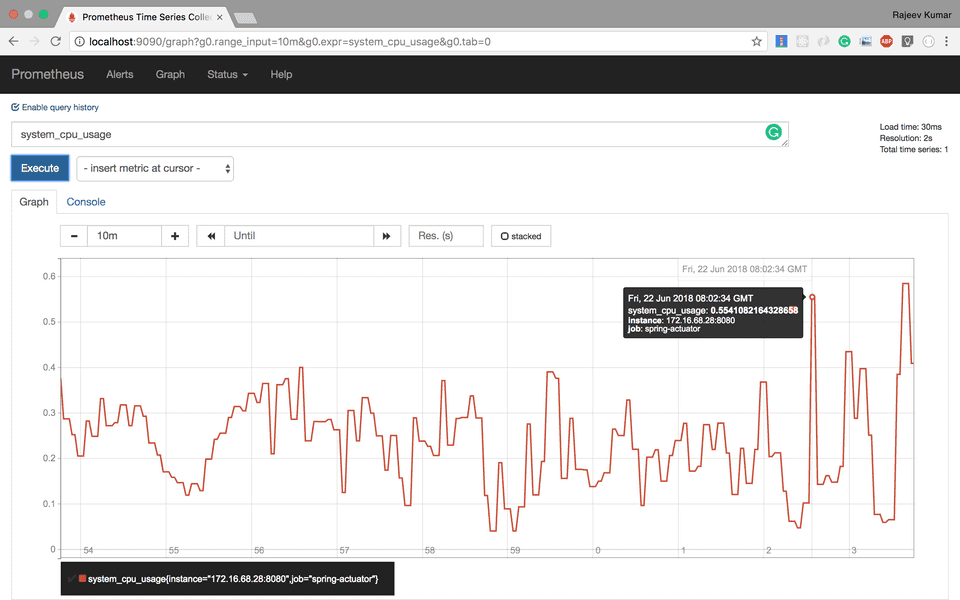
You can enter a Prometheus query expression inside the Expression text field and visualize all the metrics for that query.
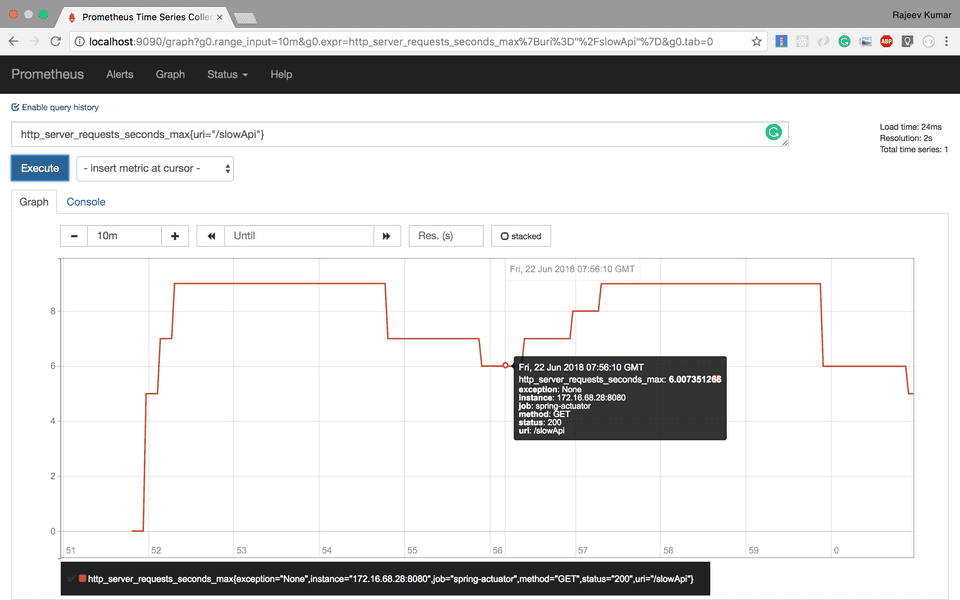
Following are some Prometheus graphs for our Spring Boot application’s metrics -
- System’s CPU usage -
- Response latency of a slow API -
 You can check out the official Prometheus documentation to learn more about
 Prometheus Query Expressions.
Downloading and running Grafana using Docker
Type the following command to download and run Grafana using Docker -
$ docker run -d --name=grafana -p 3000:3000 grafana/grafana The above command will start Grafana inside a Docker container and make it available on port 3000 on the Host machine.
You can type docker container ls to see the list of Docker containers -
$ docker container ls
CONTAINER ID        IMAGE               COMMAND                  CREATED                  STATUS              PORTS                    NAMES
cf9196b30d0d        grafana/grafana     "/run.sh"                Less than a second ago   Up 5 seconds        0.0.0.0:3000->3000/tcp   grafana
e036eb20b8ad        prom/prometheus     "/bin/prometheus --c…"   16 minutes ago           Up 16 minutes       0.0.0.0:9090->9090/tcp   prometheus
That’s it! You can now navigate to http://localhost:3000 and log in to Grafana with the default username admin and password admin.
Configuring Grafana to import metrics data from Prometheus
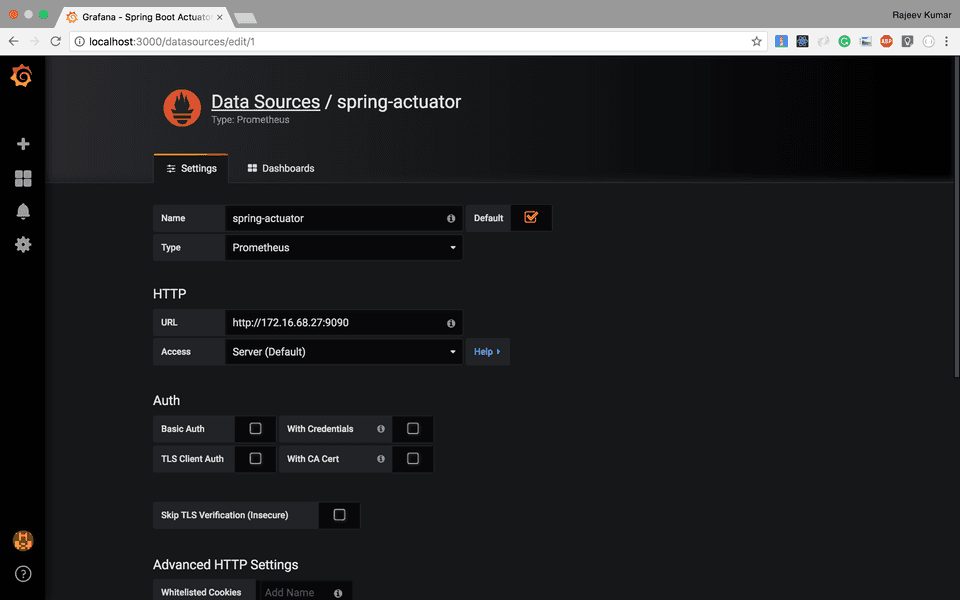
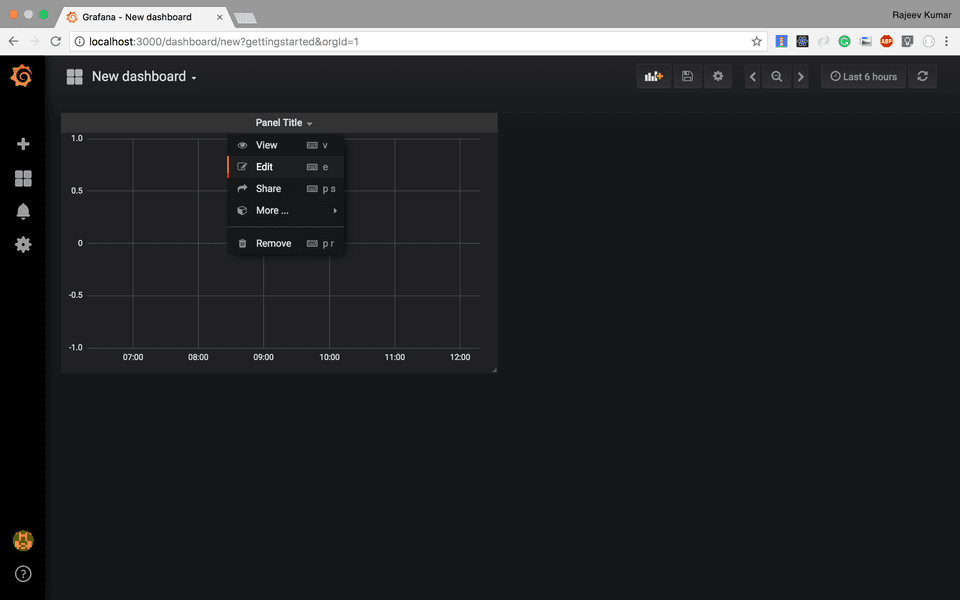
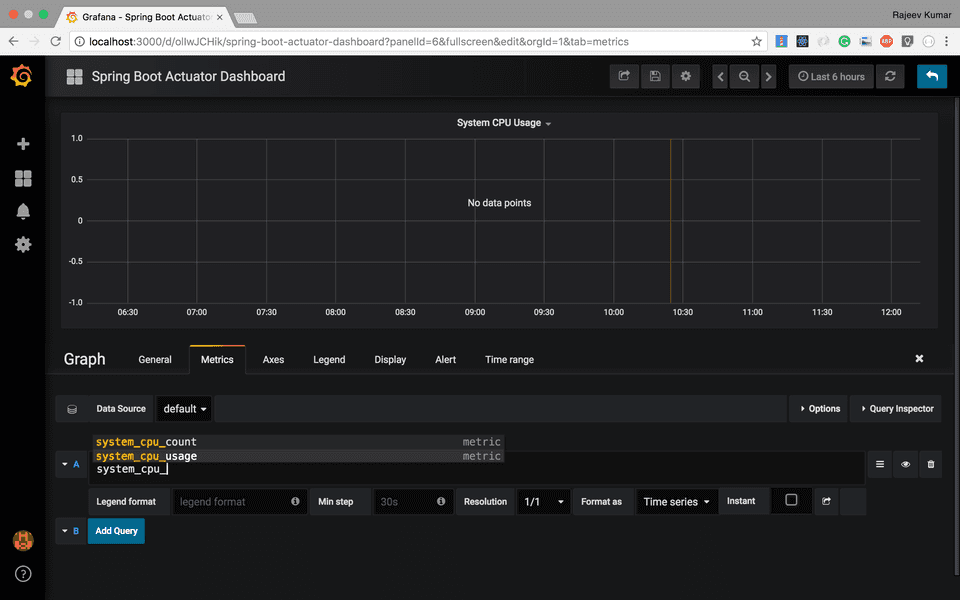
Follow the steps below to import metrics from Prometheus and visualize them on Grafana:
1. Add the Prometheus data source in Grafana
2. Create a new Dashboard with a Graph
3. Add a Prometheus Query expression in Grafana’s query editor
4. Visualize metrics from Grafana’s dashboard
 You can find the complete source code for the Actuator Demo application on Github.
Read the First Part: Spring Boot Actuator: Health check, Auditing, Metrics gathering and Monitoring
