Spring Boot Actuator: Health check, Auditing, Metrics gathering and Monitoring
Spring BootJune 19, 20185 mins readSpring Boot Actuator module helps you monitor and manage your Spring Boot application by providing production-ready features like health check-up, auditing, metrics gathering, HTTP tracing etc. All of these features can be accessed over JMX or HTTP endpoints.
Actuator also integrates with external application monitoring systems like Prometheus, Graphite, DataDog, Influx, Wavefront, New Relic and many more. These systems provide you with excellent dashboards, graphs, analytics, and alarms to help you monitor and manage your application from one unified interface.
Actuator uses Micrometer, an application metrics facade to integrate with these external application monitoring systems. This makes it super easy to plug-in any application monitoring system with very little configuration.
I’ve divided the Spring Boot Actuator tutorial into two parts -
The first part (this article) teaches you how to configure Actuator in a spring boot application and access its features via HTTP endpoints.
The second part will teach you how to integrate Actuator with an external application monitoring system.
Creating a Spring Boot application with Actuator
Let’s create a simple Spring Boot application with actuator dependency so that we can explore all its features in this article.
You can create the app using Spring Boot CLI like so -
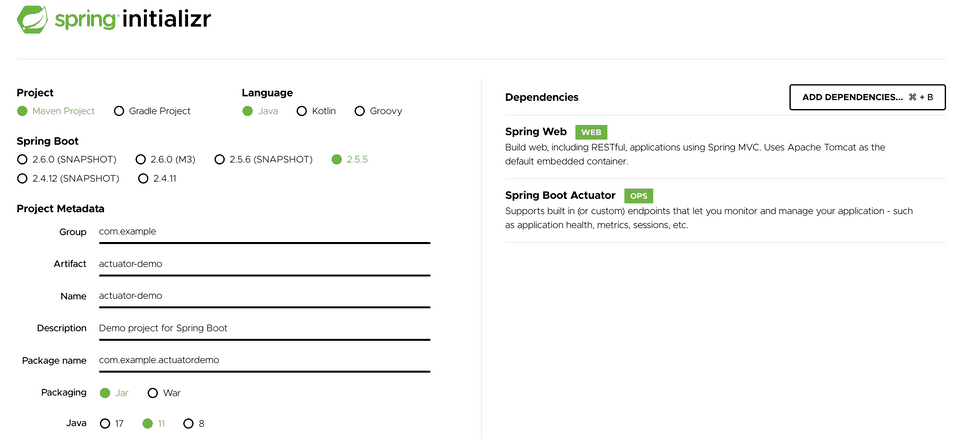
spring init -d=web,actuator -n=actuator-demo actuator-demoAlternatively, you can generate the app from Spring Initializr website -
Adding Spring Boot Actuator to an existing application
You can add spring-boot-actuator module to an existing spring boot application using the following dependency.
<dependencies>
	<dependency>
		<groupId>org.springframework.boot</groupId>
		<artifactId>spring-boot-starter-actuator</artifactId>
	</dependency>
</dependencies>
For Gradle, add the dependency like this -
dependencies {
	compile("org.springframework.boot:spring-boot-starter-actuator")
}
Monitoring your application through Actuator Endpoints
Actuator creates several so-called endpoints that can be exposed over HTTP or JMX to let you monitor and interact with your application.
For example, There is a /health endpoint that provides basic information about the application’s health. The /metrics endpoint shows several useful metrics information like JVM memory used, system CPU usage, open files, and much more. The /loggers endpoint shows application’s logs and also lets you change the log level at runtime.
Note that, every actuator endpoint can be explicitly enabled and disabled. Moreover, the endpoints also need to be exposed over HTTP or JMX to make them remotely accessible.
Let’s first run the application and try to access the actuator endpoints that are enabled and exposed over HTTP by default. After that, we’ll learn how to enable more actuator endpoints and also expose them over HTTP.
Type the following command from the root directory of the application to run it -
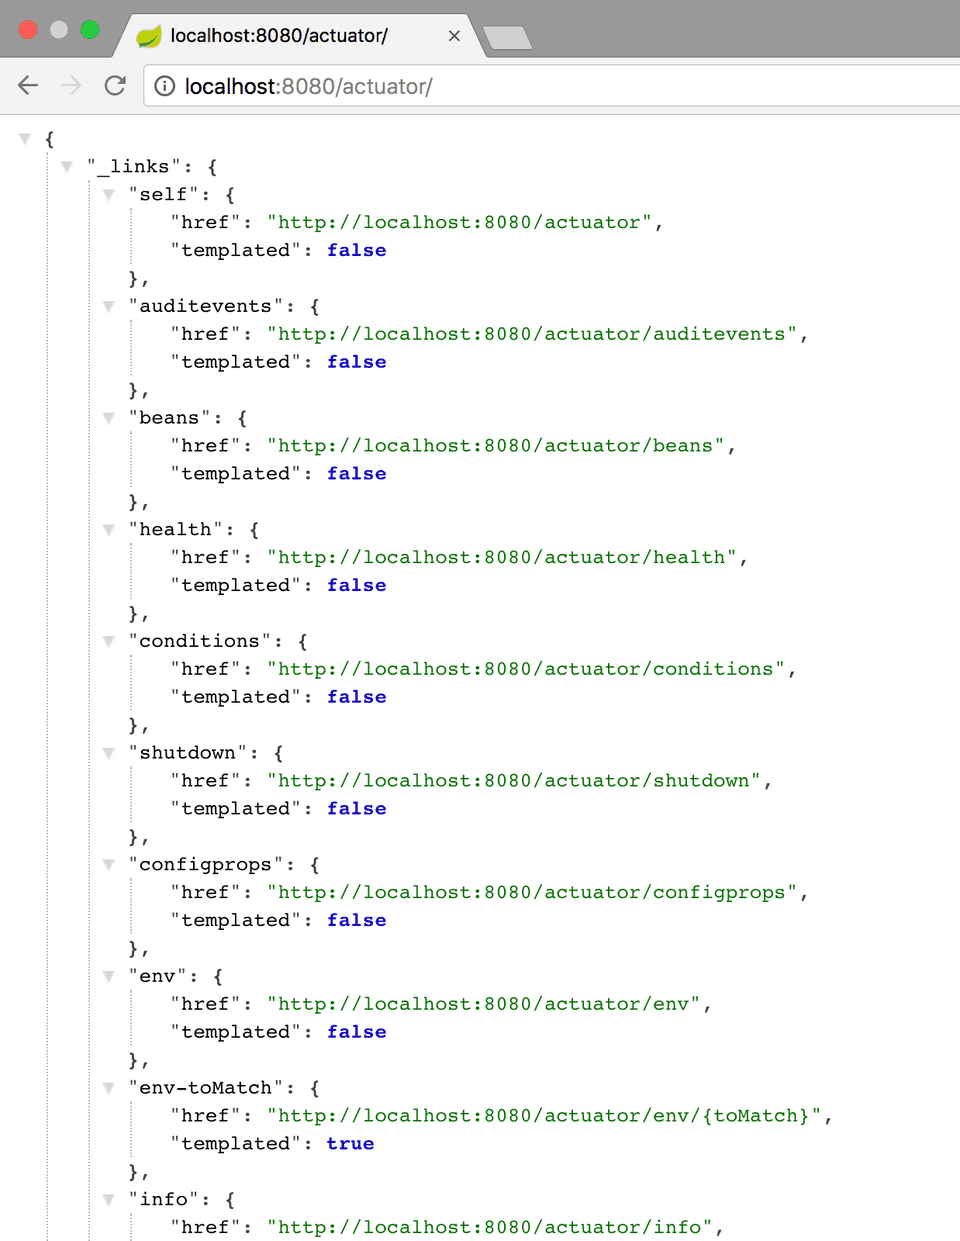
mvn spring-boot:runThe application will start on port 8080 by default. Once the application has started, you can list all the actuator endpoints exposed over HTTP from the URL http://localhost:8080/actuator.
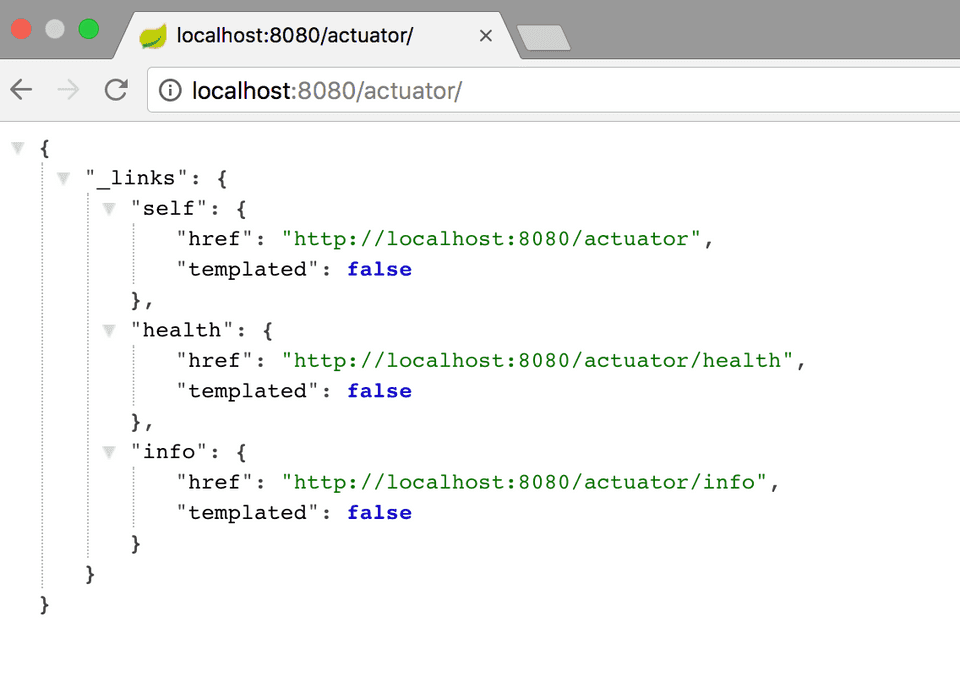 Let’s explore the
 health endpoint by opening the http://localhost:8080/actuator/health URL. The endpoint should display the following -
{
    "status": "UP"
}
The status will be UP as long as the application is healthy. It will show DOWN if the application gets unhealthy due to any issue like connectivity with the database or lack of disk space etc. Check out the next section to learn more about how Spring Boot determines the health of your application and how you can tweak it.
The info endpoint (http://localhost:8080/actuator/info) displays general information about your application obtained from build files like META-INF/build-info.properties or Git files like git.properties or through any environment property under the key info. You’ll learn how to tweak the output of this endpoint in the next section.
By default, only the health and info endpoints are exposed over HTTP. That’s why the /actuator page lists only the health and info endpoints. We’ll learn how to expose other endpoints shortly. First, Let’s see what those endpoints are and what do they offer you.
Following is a list of some super useful actuator endpoints. You can see the complete list on the official documentation.
| Endpoint ID | Description |
|---|---|
| auditevents | Exposes audit events (e.g. auth_success, order_failed) for your application |
| info | Displays information about your application. |
| health | Displays your application’s health status. |
| metrics | Shows various metrics information of your application. |
| loggers | Displays and modifies the configured loggers. |
| logfile | Returns the contents of the log file (if logging.file or logging.path properties are set.) |
| httptrace | Displays HTTP trace info for the last 100 HTTP request/response. |
| env | Displays current environment properties. |
| flyway | Shows details of Flyway database migrations. |
| liquidbase | Shows details of Liquibase database migrations. |
| shutdown | Lets you shut down the application gracefully. |
| mappings | Displays a list of all @RequestMapping paths. |
| scheduledtasks | Displays the scheduled tasks in your application. |
| threaddump | Performs a thread dump. |
| heapdump | Returns a GZip compressed JVM heap dump. |
Enabling and Disabling Actuator Endpoints
By default, all the endpoints that I listed in the previous section are enabled except the shutdown endpoint.
You can enable or disable an actuator endpoint by setting the property management.endpoint.<id>.enabled to true or false (where id is the identifier for the endpoint).
For example, to enable the shutdown endpoint, add the following to your application.properties file -
management.endpoint.shutdown.enabled=trueExposing Actuator Endpoints
By default, all the actuator endpoints are exposed over JMX but only the health and info endpoints are exposed over HTTP.
Here is how you can expose actuator endpoints over HTTP and JMX using application properties -
Exposing Actuator endpoints over HTTP
# Use "*" to expose all endpoints, or a comma-separated list to expose selected ones
management.endpoints.web.exposure.include=health,info
management.endpoints.web.exposure.exclude=
Exposing Actuator endpoints over JMX
# Use "*" to expose all endpoints, or a comma-separated list to expose selected ones
management.endpoints.jmx.exposure.include=*
management.endpoints.jmx.exposure.exclude=
Let’s expose all actuator endpoints by setting the property management.endpoints.web.exposure.include to * and check the output of http://localhost:8080/actuator page. You’ll notice that the actuator page now lists all the enabled endpoints-
Exploring common actuator endpoints
/health endpoint
The health endpoint checks the health of your application by combining several health indicators.
Spring Boot Actuator comes with several predefined health indicators like DataSourceHealthIndicator, DiskSpaceHealthIndicator, MongoHealthIndicator, RedisHealthIndicator, CassandraHealthIndicator etc. It uses these health indicators as part of the health check-up process.
For example, If your application uses Redis, the RedisHealthIndicator will be used as part of the health check-up. If your application uses MongoDB, the MongoHealthIndicator will be used as part of the health check-up and so on.
You can also disable a particular health indicator using application properties like so -
management.health.mongo.enabled=falseBut by default, all these health indicators are enabled and used as part of the health check-up process.
Displaying detailed health information
The health endpoint only shows a simple UP or DOWN status. To get the complete details including the status of every health indicator that was checked as part of the health check-up process, add the following property in the application.properties file -
# HEALTH ENDPOINT
management.endpoint.health.show-details=always
Once you do that, the health endpoint will display more details like this -
{
   "status":"UP",
   "details":{
      "diskSpace":{
         "status":"UP",
         "details":{
            "total":250790436864,
            "free":100327518208,
            "threshold":10485760
         }
      }
   }
}
The health endpoint now includes the details of the DiskSpaceHealthIndicator which is run as part of the health checkup process.
If your application has a database (say MySQL), the health endpoint will show the status of that as well -
{
   "status":"UP",
   "details":{
      "db":{
         "status":"UP",
         "details":{
            "database":"MySQL",
            "hello":1
         }
      },
      "diskSpace":{
         "status":"UP",
         "details":{
            "total":250790436864,
            "free":100330897408,
            "threshold":10485760
         }
      }
   }
}
If your MySQL server goes down, the status will change to DOWN -
{
   "status":"DOWN",
   "details":{
      "db":{
         "status":"DOWN",
         "details":{
            "error":"org.springframework.jdbc.CannotGetJdbcConnectionException: Failed to obtain JDBC Connection; nested exception is java.sql.SQLTransientConnectionException: HikariPool-1 - Connection is not available, request timed out after 30006ms."
         }
      },
      "diskSpace":{
         "status":"UP",
         "details":{
            "total":250790436864,
            "free":100324585472,
            "threshold":10485760
         }
      }
   }
}
Creating a Custom Health Indicator
You can also create a custom health indicator by implementing the HealthIndicator interface, or extending the AbstractHealthIndicator class -
package com.example.actuatordemo.health;

import org.springframework.boot.actuate.health.AbstractHealthIndicator;
import org.springframework.boot.actuate.health.Health;
import org.springframework.stereotype.Component;

@Component
public class CustomHealthIndicator extends AbstractHealthIndicator {

    @Override
    protected void doHealthCheck(Health.Builder builder) throws Exception {
        // Use the builder to build the health status details that should be reported.
        // If you throw an exception, the status will be DOWN with the exception message.

        builder.up()
                .withDetail("app", "Alive and Kicking")
                .withDetail("error", "Nothing! I'm good.");
    }
}
Once you add the above health indicator in your application, the health endpoint will start showing its details as well -
{
   "status":"UP",
   "details":{
      "custom":{
         "status":"UP",
         "details":{
            "app":"Alive and Kicking",
            "error":"Nothing! I'm good."
         }
      },
      "diskSpace":{
         "status":"UP",
         "details":{
            "total":250790436864,
            "free":97949245440,
            "threshold":10485760
         }
      }
   }
}
/metrics endpoint
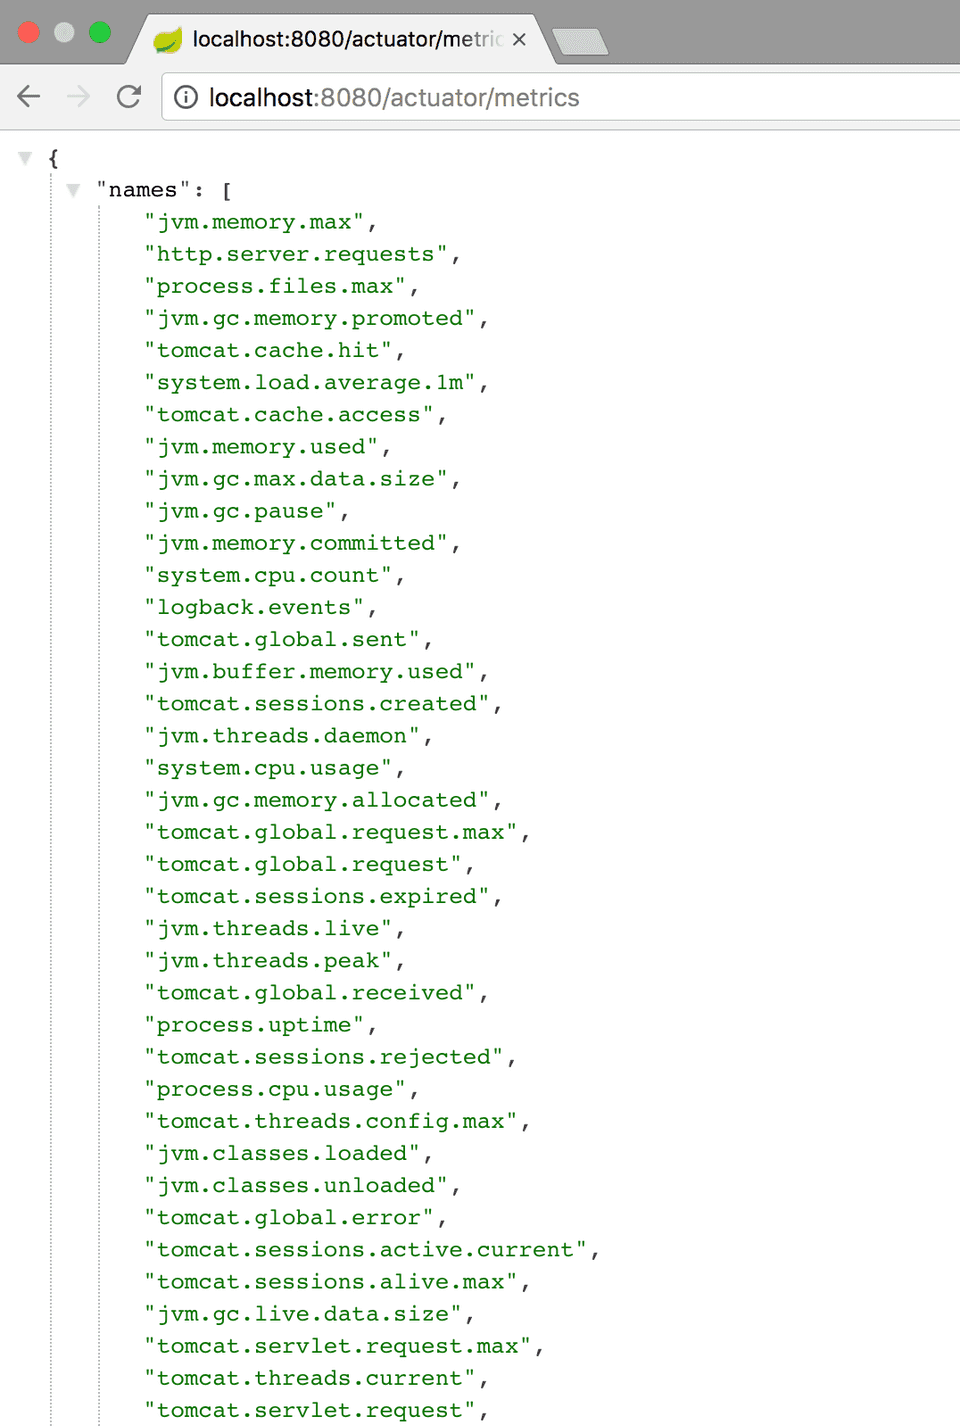
The /metrics endpoint lists all the metrics that are available for you to track.
To get the details of an individual metric, you need to pass the metric name in the URL like this -
http://localhost:8080/actuator/metrics/{MetricName}.
For example, to get the details of system.cpu.usage metric, use the URL http://localhost:8080/actuator/metrics/system.cpu.usage. This will display the details in JSON format like so -
{
   "name":"system.cpu.usage",
   "measurements":[
      {
         "statistic":"VALUE",
         "value":0.11774479321066383
      }
   ],
   "availableTags":[

   ]
}
/loggers endpoint
The loggers endpoint, which can be accessed at http://localhost:8080/actuator/loggers, displays a list of all the configured loggers in your application with their corresponding log levels.
You can also view the details of an individual logger by passing the logger name in the URL like this -
http://localhost:8080/actuator/loggers/{name}.
For example, to get the details of the root logger, use the URL http://localhost:8080/actuator/loggers/root.
{
   "configuredLevel":"INFO",
   "effectiveLevel":"INFO"
}
Changing log levels at runtime.
The loggers endpoint also allows you to change the log level of a given logger in your application at runtime.
For example, To change the log level of the root logger to DEBUG at runtime, make a POST request to the URL http://localhost:8080/actuator/loggers/root with the following payload -
{
   "configuredLevel": "DEBUG"
}
This functionality will really be useful in cases when your application is facing issues in production and you want to enable DEBUG logging for some time to get more details about the issue.
To reset the log-level to the default value, you can pass a value of null in the configuredLevel field.
/info endpoint
The info endpoint displays arbitrary information about your application. It obtains build information from META-INF/build-info.properties file, Git information from git.properties file. It also displays any information available in environment properties under the key info.
You can add properties under the key info in application.properties file like so -
# INFO ENDPOINT CONFIGURATION
info.app.name=@project.name@
info.app.description=@project.description@
info.app.version=@project.version@
info.app.encoding=@project.build.sourceEncoding@
info.app.java.version=@java.version@
Note that, I’m using Spring Boot’s Automatic property expansion feature to expand properties from the maven project.
Once you add the above properties, the info endpoint (http://localhost:8080/actuator/info) will start displaying the information like so -
{
   "app":{
      "name":"actuator-demo",
      "description":"Spring Boot Actuator Demo Project",
      "version":"0.0.1-SNAPSHOT",
      "encoding":"UTF-8",
      "java":{
         "version":"1.8.0_112"
      }
   }
}
Securing Actuator Endpoints with Spring Security
Actuator endpoints are sensitive and must be secured from unauthorized access. If Spring Security is present in your application, then the endpoints are secured by default using a form-based HTTP basic authentication.
If not, you can add spring security to your application using the following dependency -
<dependency>
   <groupId>org.springframework.boot</groupId>
   <artifactId>spring-boot-starter-security</artifactId>
</dependency>
Let’s now see how we can override the default spring security configuration and define our own access rules.
The following example shows a sample spring security configuration that uses a convenient RequestMatcher factory called EndPointRequest provided by spring-boot-actuator module to configure access rules for Actuator endpoints -
package com.example.actuatordemo.config;

import org.springframework.boot.actuate.autoconfigure.security.servlet.EndpointRequest;
import org.springframework.boot.actuate.context.ShutdownEndpoint;
import org.springframework.boot.autoconfigure.security.servlet.PathRequest;
import org.springframework.context.annotation.Configuration;
import org.springframework.security.config.annotation.web.builders.HttpSecurity;
import org.springframework.security.config.annotation.web.configuration.WebSecurityConfigurerAdapter;

@Configuration
public class ActuatorSecurityConfig extends WebSecurityConfigurerAdapter {

    /*
        This spring security configuration does the following

        1. Restrict access to the Shutdown endpoint to the ACTUATOR_ADMIN role.
        2. Allow access to all other actuator endpoints.
        3. Allow access to static resources.
        4. Allow access to the home page (/).
        5. All other requests need to be authenticated.
        5. Enable http basic authentication to make the configuration complete.
           You are free to use any other form of authentication.
     */

    @Override
    protected void configure(HttpSecurity http) throws Exception {
        http
                .authorizeRequests()
                    .requestMatchers(EndpointRequest.to(ShutdownEndpoint.class))
                        .hasRole("ACTUATOR_ADMIN")
                    .requestMatchers(EndpointRequest.toAnyEndpoint())
                        .permitAll()
                    .requestMatchers(PathRequest.toStaticResources().atCommonLocations())
                        .permitAll()
                    .antMatchers("/")
                        .permitAll()
                    .antMatchers("/**")
                        .authenticated()
                .and()
                .httpBasic();
    }
}
To be able to test the above configuration with HTTP basic authentication, you can add a default spring security user in application.properties like so -
# Spring Security Default user name and password
spring.security.user.name=actuator
spring.security.user.password=actuator
spring.security.user.roles=ACTUATOR_ADMIN
You can find the complete source code on Github.
Continue to the Next Part: Spring Boot Actuator metrics monitoring with Prometheus and Grafana
